
 English
 Português
 Español
 Français
 Italiano
 Nederlands
 Svenska
 Count and graph
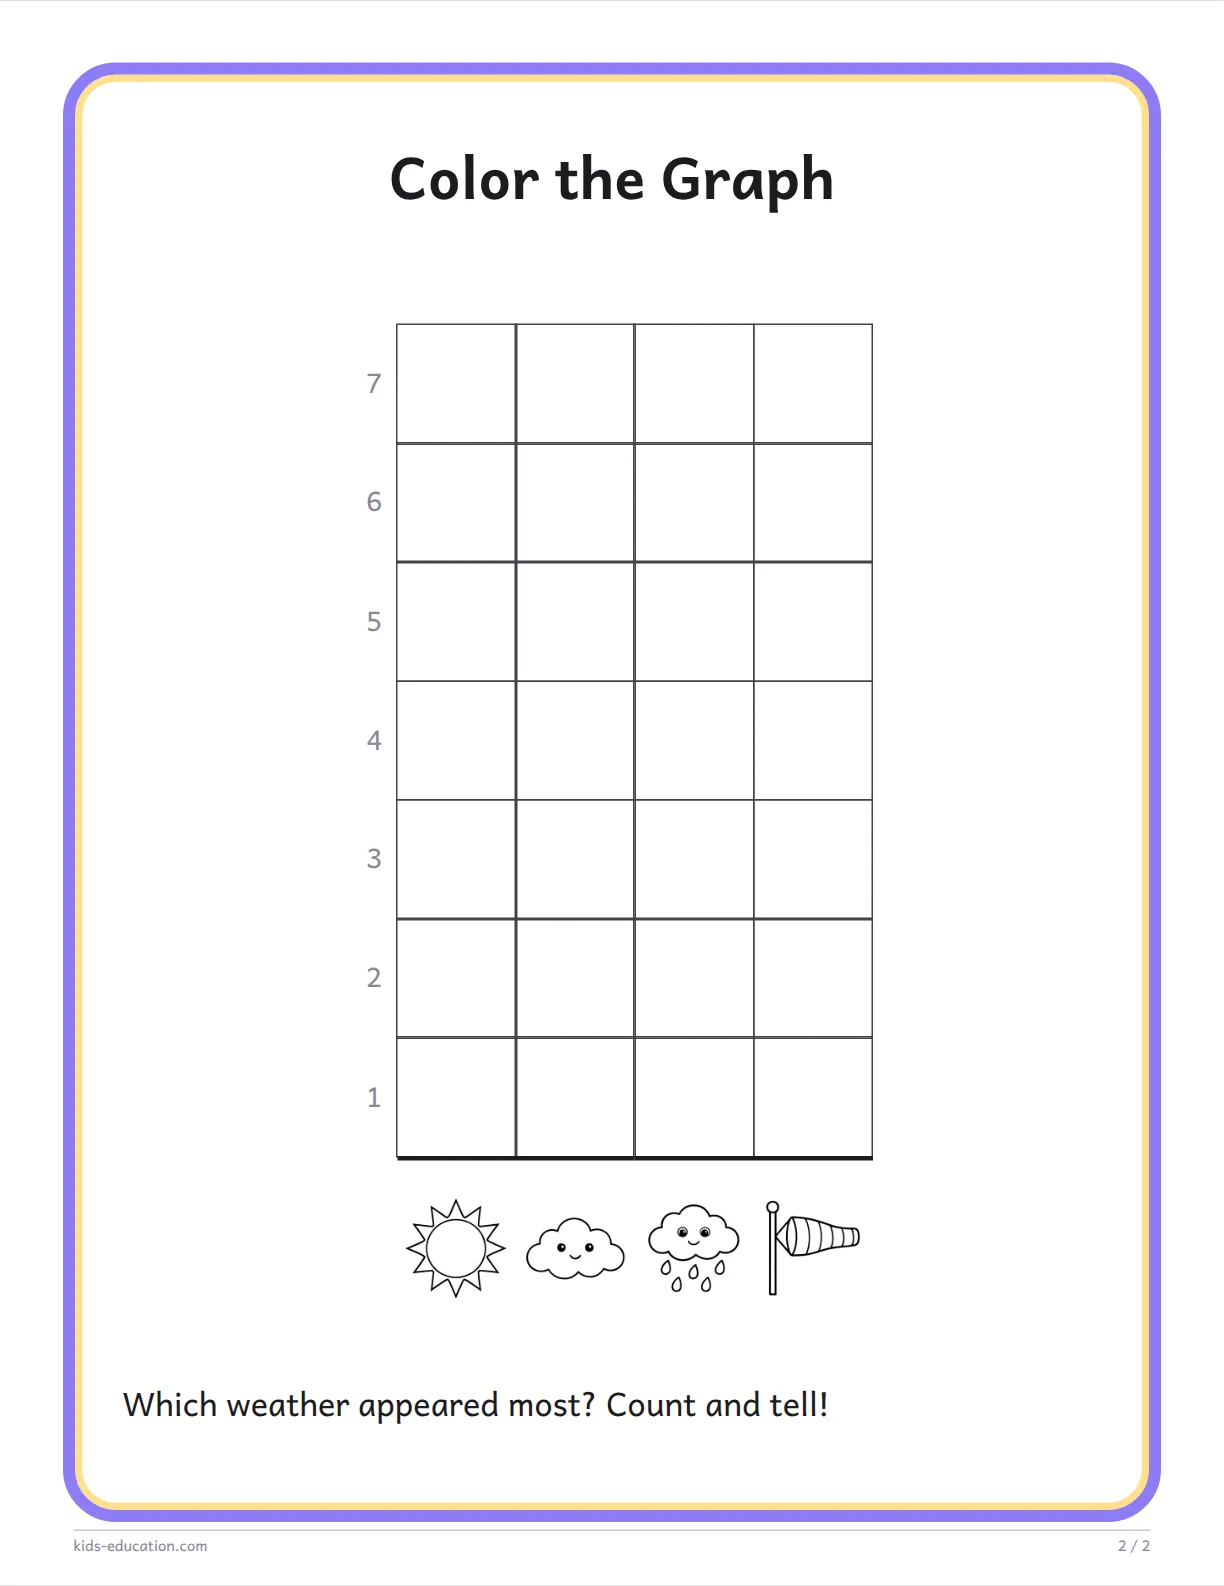
Weekly Weather Graph
Weather This Week
Observe and record the weather for seven days, then color a graph to find out which kind of weather appeared most often.
- Age 5
- 5 min
- Easy
- Any group size
- Count and graph
Learning areas
About this activity
For one week, children observe the weather and record whether it is sunny, cloudy, rainy, or windy. At the end of the week, they color one square on the graph for each day.
As they count and compare the columns, children practice counting and notice how the weather can change from day to day.
Learning objectives
- Record one weather condition for each day of the week.
- Color one square for each day recorded.
- Count and compare the columns to find which weather condition appeared most often.
The printable
Print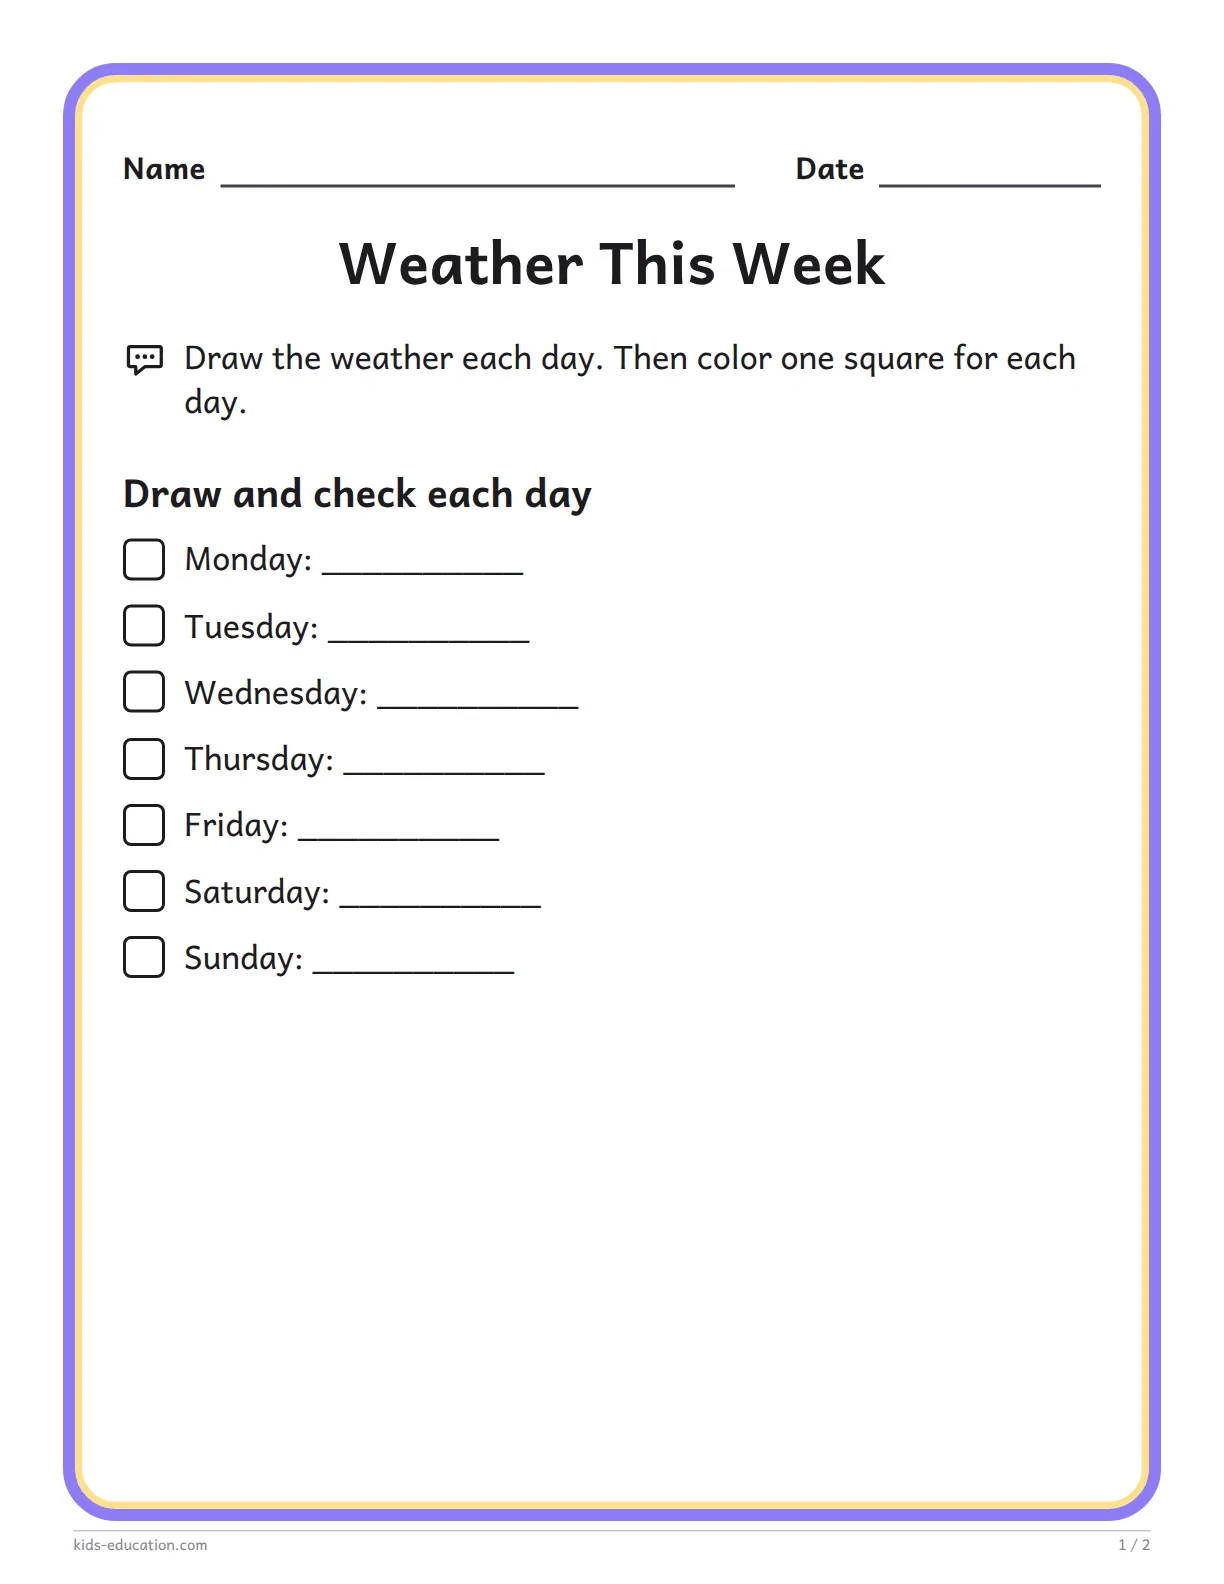
What you need
- Printed activity sheet
- Pencil or crayon
- Colored pencils or crayons for the graph
Safety notes
Observe the weather from a safe place, and do not look directly at the sun. During heavy rain or a storm, observe from indoors.
How to do it
- Keep the sheet and materials somewhere accessible during the week.
- Observe the weather with your child and talk about sunshine, clouds, rain, and wind.
- Show your child how to draw a simple symbol next to the day and tick the box.
- Invite your child to observe and record one weather condition each day for seven days.
- At the end of the week, help your child color one square on the graph for each recorded day.
- Count the columns together and find out which weather condition appeared most often.
Teaching suggestions
- Observe the weather at about the same time each day.
- If there is more than one weather condition, help your child choose the one they noticed most.
- Draw simple symbols together: a circle for the sun, a cloud, raindrops, or lines for wind.
- Point to each record and then to one square as you count.
- In a group, talk about the weather and make one shared record each day.
Variations
Make it easier
Draw the symbols your child suggests and help them color and count the squares.
Make it harder
Ask your child how many more days are in the tallest column than in another column.
Extend the activity
Make another sheet the following week and compare the results.
Talk about it
- What did you notice in the sky today?
- How could you tell it was windy or rainy?
- Which kind of weather appeared most often? How did you find out?
- What happened if two kinds of weather appeared the same number of times?
What to look for
- Notice whether the child records one weather condition for each day.
- Check whether they color one square for each record.
- Listen as they count and compare the columns, including noticing a possible tie.
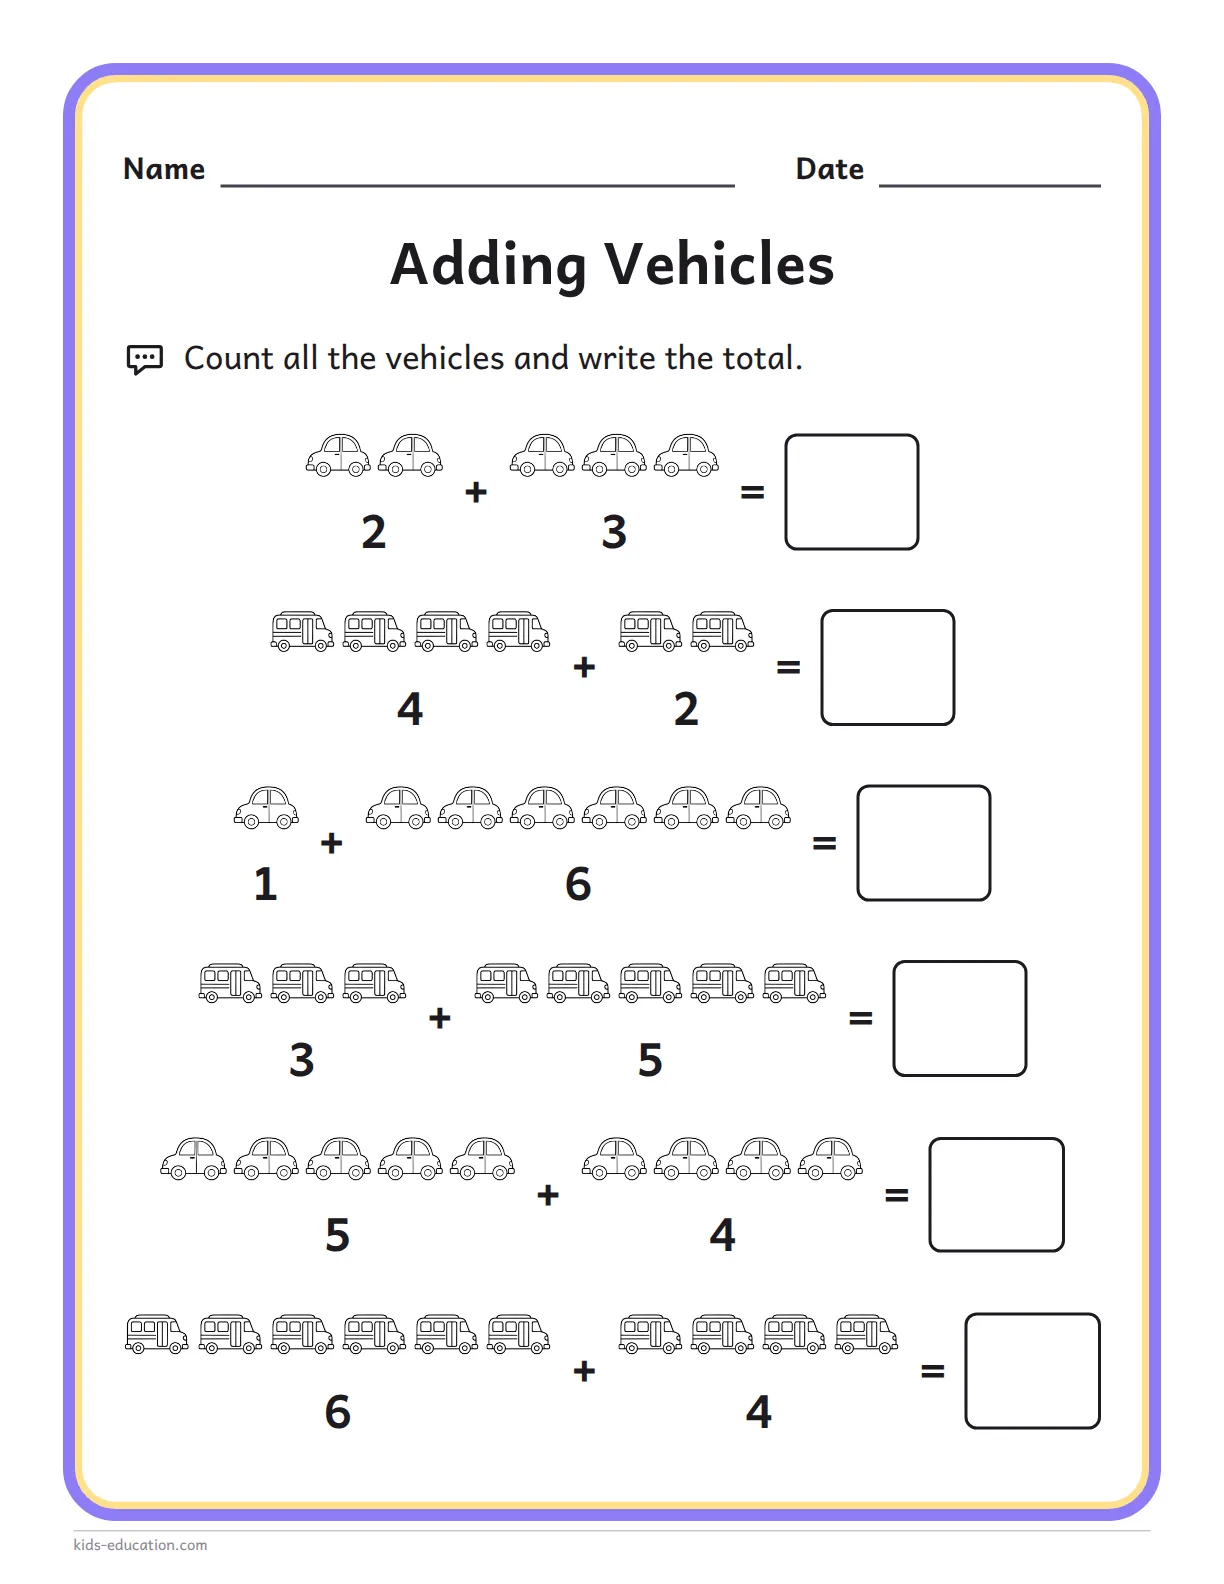
 Picture math
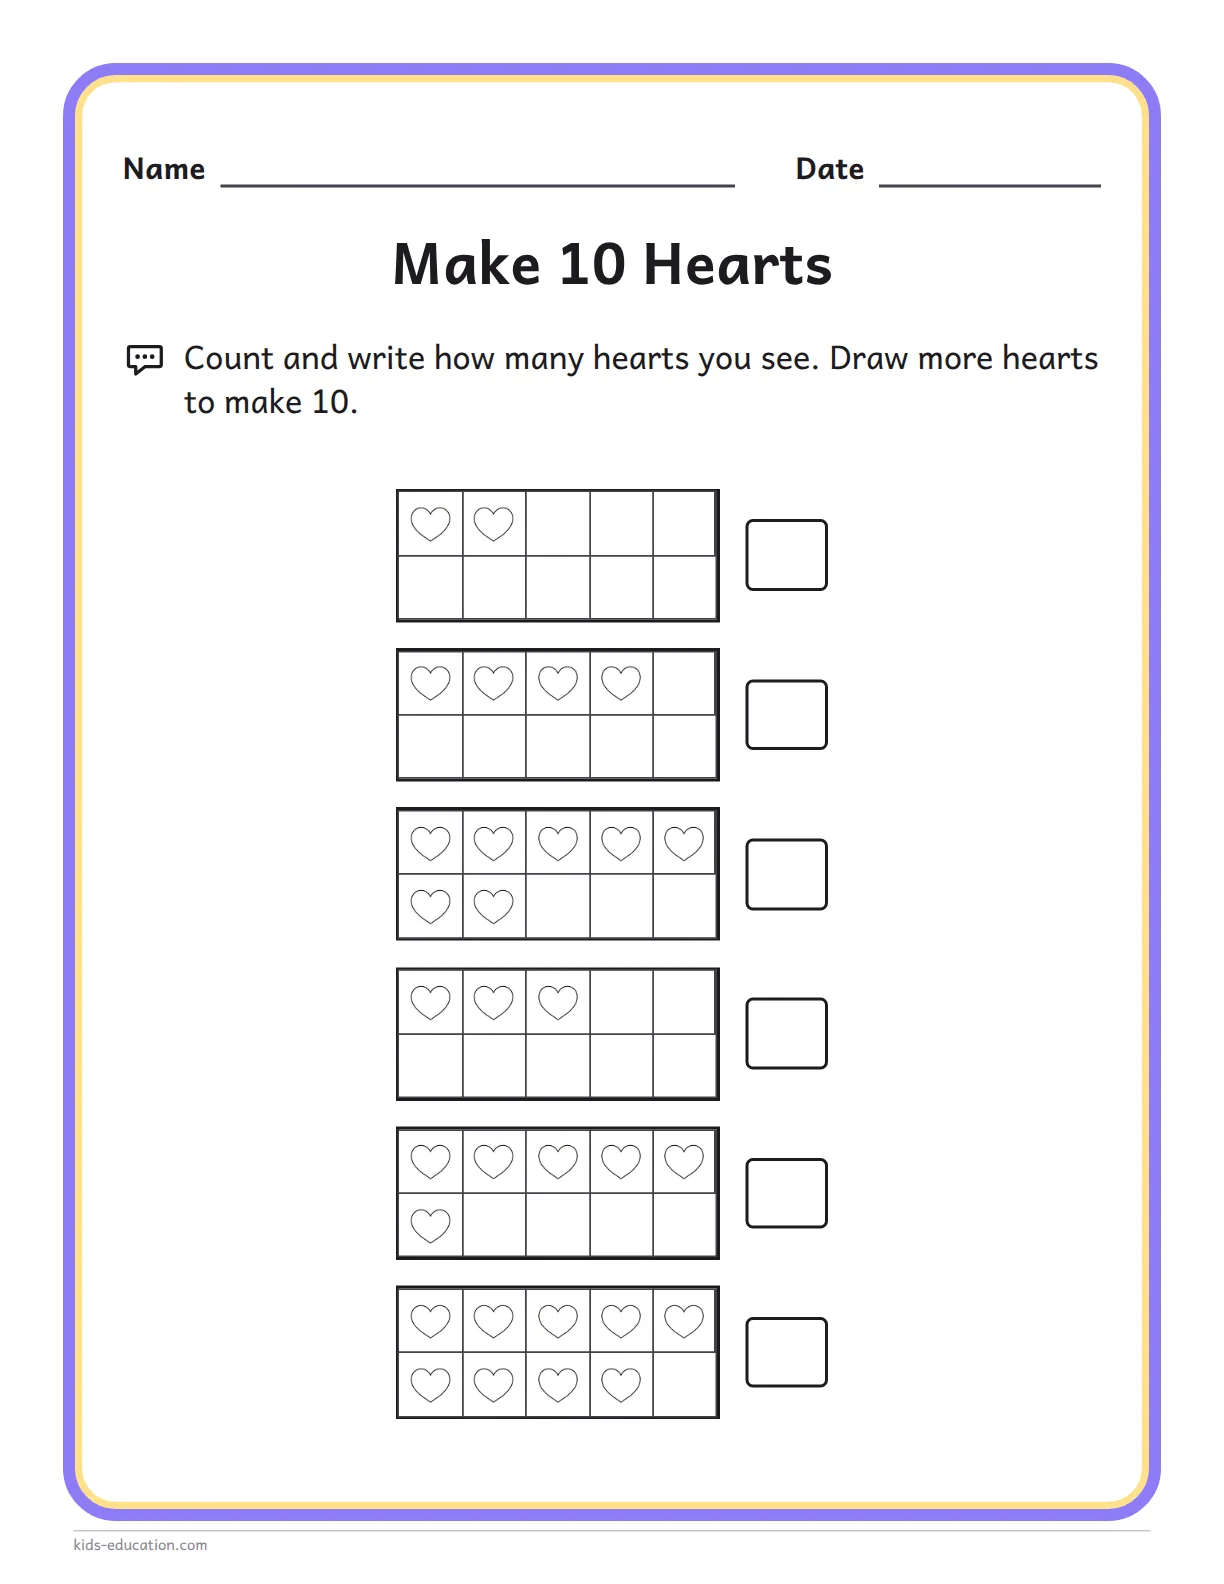
 Ten frames
 I spy and count